An Overview of NPS for Customer Service Teams


If you have ever received an email asking “How likely are you to recommend regrettable-airport-bagel-store?” then you have seen an NPS question in the wild.
Net Promoter Score (NPS) is a popular customer loyalty metric deployed across many industries and business units. In this article, we’ll cover the basics of NPS for customer service teams: How to measure it, how to use it effectively, and tips on how support teams can help increase their company's NPS.
Learn what support metrics to measure and how to report your successes to company leadership.
What is NPS?
NPS stands for Net Promoter Score, and it is intended to measure customer loyalty. NPS was created by Fred Reichheld and was first discussed in his 2003 HBR article “The One Number You Need to Grow.” Reichheld went on to publish his book The Ultimate Question on the same topic.
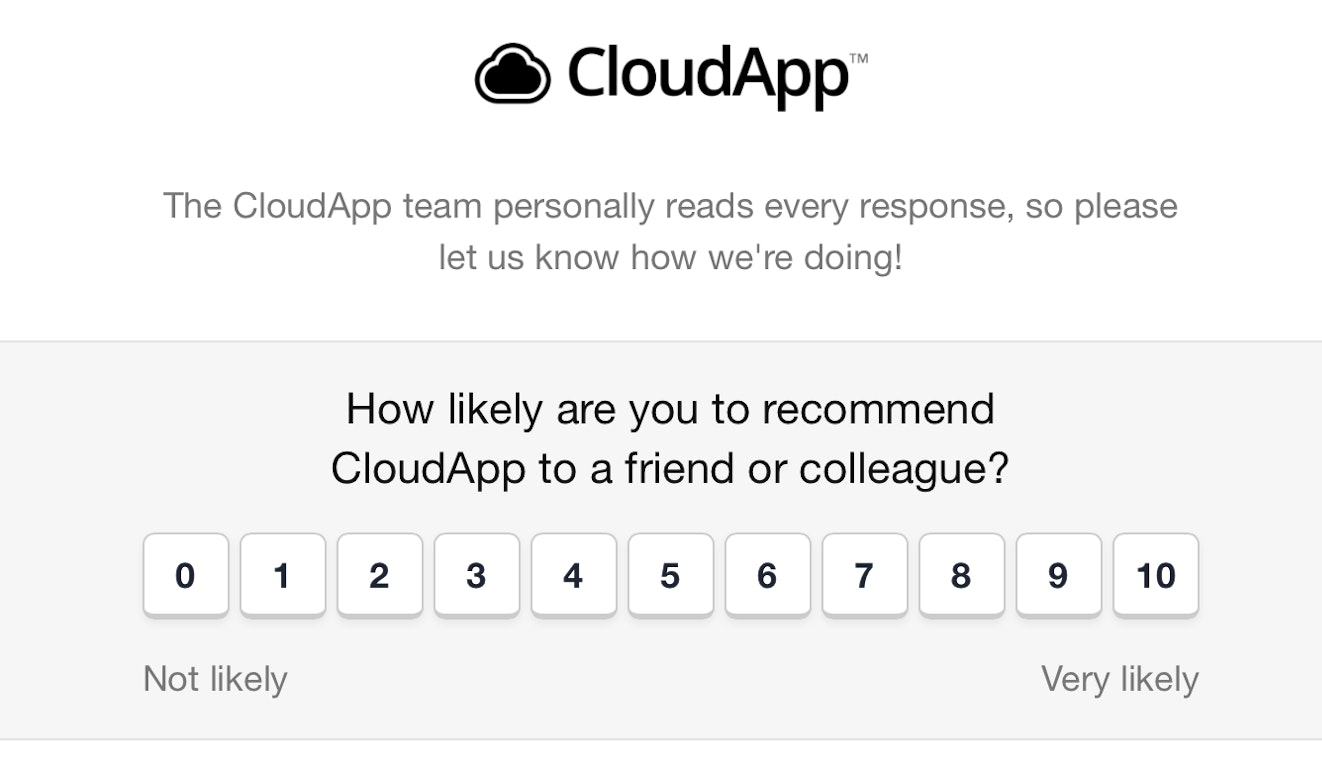
The official NPS question uses the wording and 11 point scale shown in this example:

How to calculate NPS
First, send some of your customer base the NPS question. You will want a response volume large enough to be statistically significant and broad enough not to introduce bias in the results. Once you have collected all of the responses, calculating your Net Promoter Score is simple.
Categorize each respondent
Group all of the people who answered your NPS question into the three groups Reicheld defines:
Promoters (people who answered with 9 or 10) – These people are likely to be loyal customers and recommend you to others.
Passives (people who answered with 7 or 8) – These people are satisfied, but less likely to actively promote your business to others, and they may be more likely to switch to an alternative.
Detractors (people who answered with 6 or under) – These customers may be spreading negative word-of-mouth about your organization.
Calculate your score
Your NPS is a number between -100 and +100. To find your NPS, subtract the percentage of Detractors in your answer set from the percentage of Promoters.
For example, if you surveyed 500 customers you might end up with these results:
Promoters: 165 (33%)
Passives: 260 (52%)
Detractors: 75 (15%)
Calculate your score like so:
Promoters (33%) - Detractors (15%) = a Net Promoter Score of +18
Remember, your NPS is a number, not a percentage.
What is a good NPS score?
Here’s the simple answer: A positive NPS score (+1 to +100) is generally considered good, and a score of 50+ is considered excellent.
In practice, your raw Net Promoter Score isn’t as important as how your NPS compares to your direct competitors. What matters most is whether customers in your industry are more likely to recommend your business than an alternative business providing a similar product or service.
For example, a “low” NPS of +20 could still correlate with greater loyalty and business growth than an NPS of +60 if all your competitors have scores below +20.
| Industry | Typical Score |
|---|---|
Education | 69 |
B2B Services | 69 |
Health | 63 |
Manufacturing | 61 |
Technology | 60 |
Public Sector | 52 |
Financial Services | 50 |
Online Retail | 43 |
Department Stores | 40 |
Grocery stores | 39 |
Software | 35 |
Telecommunications | 32 |
Travel websites | 18 |
Cable TV services | -6 |
Internet services | -7 |
Note: These public sources measure different companies, and they do not agree on average scores for the same industries. It is best to compare your score against that of your specific competitors whenever possible.
NPS benchmarking sources
Should customer service teams own NPS?
Who should own your company's NPS score? It is a measure of customer loyalty, so it makes sense to consider the customer-facing team as the one most likely to generate (or reduce) that loyalty. However, NPS is about more than service.
Asking someone how likely it is that they would recommend your company to a friend or colleague is a very broad question. Consider it for yourself: What factors would you consider before recommending a product or a service to someone?
You might think about the quality of the actual product, tool, or service; the usability of their system; the cost; the availability in your local area; alternative options; and much more. Whatever your list is, it will likely extend beyond “How ‘good’ is their customer service?”
Your Net Promoter Score can move up and down based on factors well outside the control of the customer service organization, so in some cases, other teams may be better positioned to own NPS.
For example, in some SaaS companies Product teams own NPS, because they control most of the customer experience. The right answer will depend on your particular business, but as a general principle, NPS is best owned at a high level — for example, by a Customer Experience Head or Chief Customer Officer — someone who has the ability to influence most of the factors that affect customer loyalty.
Limitations and flaws of NPS
NPS is a very simple measurement to make and to understand. In fact, it was originally pitched as “the one number you need to grow.” However, as NPS grew in popularity, a number of concerns were raised:
NPS is not a good predictor of business growth
Several researchers have studied the performance of NPS scores as a predictor of actual company growth. Keiningham et al. (2007) attempted to replicate the original NPS research technique and concluded it was “obvious that Net Promoter cannot reasonably be categorized as the ‘single most reliable indicator of a company's ability to grow.’”
NPS explicitly measures what people say they would do (i.e., recommend you or not), but it does not seem to correlate consistently with actual customer behavior. Several studies suggest that asking customers more questions produces a stronger predictor.
NPS is too sensitive a measure
In their article “The problems with net promoter scores: how to better measure customer advocacy,” authors Stewart and Worthington show that a company with “no detractors or promoters is regarded as being no different from having 50% detractors (at the extreme bottom of the scale) and 50% promoters.”
The nature of the NPS calculation hides that difference (when compared to a straight average) and magnifies other differences. People moving from a 6 to a 7 or from an 8 to a 9 have a disproportionate impact on your Net Promoter Score.
Results can be easily influenced
In The Wall Street Journal, Safdar and Pacheco wrote of NPS: “The results are easy to manipulate, whether intentionally or unintentionally” by, for example, not sending surveys to people likely to be detractors.
Daniel Kinal pointed out in his conference talk “The Net Promoter Score: ‘magic bullet’ or ‘snake oil’?” that an “unnamed ride share company” sent him an NPS survey which used color coding to not-so-subtly suggest the “good” choices of 9 or 10.
NPS is often separated from the reason for the score
The NPS question produces a score, but it does not answer the “why” of that score. Although Reicheld himself recommends a follow-up question — “What is the primary reason for your score?” — many companies do not ask it, so they are unable to craft a plan to change those ratings or the behaviors they're intended to predict.
For these reasons, NPS should not be the sole measure of customer satisfaction and loyalty. Even so, there is value in regularly checking with customers to determine how loyal they are to your business.
How customer service teams can improve their company’s Net Promoter Score
Rather than focus explicitly on driving up your Net Promoter Score, look for ways to create a customer experience that is more likely to produce people who want to promote your business and less likely to create bad word-of-mouth.
If you can do that, you should see improvement in your NPS. Here are our top suggestions:
1. Ask follow-up questions
After you ask your NPS question, ask those customers to explain why they gave you that rating. Their explanations will help you spot trends and make plans for improvement.
2. Follow up with your detractors
Use the information from your follow-up question to reach out to individual detractors and help them out whenever possible. Often the problems are easily resolved, and, if not, you have at least shown that you care and are willing to listen.
3. Make NPS data part of the context for customer service answers
Arm your customer service team with NPS data. If they open up a conversation in your help desk and can see the customer they are about to help has rated you poorly in the past, they can adjust their approach accordingly.
Head of Customer Experience at Brightback (and Help Scout alum) Mo McKibbin has her NPS answers feed into Typeform and then Help Scout. She uses workflows to automatically tag those conversations as detractors, passives, or promoters.
Tagged conversations then show up in the customer’s history as useful contextual data for her team to consider before answering.
4. Remember your passive raters
The NPS calculation ignores passive ratings, but you should not. If you can understand why customers would not recommend you, you may be able to address their concerns. Consider simply reaching out and asking what would need to happen in order for them to recommend you to a colleague.
5. Use other metrics to spot opportunities to improve
Review your happiness reports, social media, and other customer listening paths for the underlying causes of low customer loyalty. NPS will naturally improve if you can deliver a better overall experience.
Other metrics to use with NPS
Net Promoter Score should not be your only customer service metric. Always use NPS in combination with other metrics so you can have a clearer understanding of how your team is performing and the potential causes, good and bad, of the ratings you are receiving.
Three good options are:
Customer Satisfaction (CSAT)
Help Scout, and many other customer service software tools, includes a simple customer satisfaction survey. CSAT is a good tool for measuring individual support experiences because you can usually review those scores in the context of the specific incident the customer is rating.
CSAT is not perfect, and "satisfaction" may not be a high bar to aim for, but it tends to gather actionable and specific feedback.


Customer Effort Score (CES)
CES is an attempt to measure how much work your customer needs to put in when interacting with your business or service. Even when something goes wrong, if it's simple for your customer to get it sorted out, they may rate your company highly.
CES is usually measured by asking customers — in a single survey question — how much work they did in order to get a particular job done. Working on lowering that perceived effort level will typically result in better overall satisfaction and promotion rates.
Customer Retention Rate (CRR)
Holding on to the customers you already have is much less costly than going out to find new customers. Customer Retention Rate measures the percentage of your customer base who have stayed with you over a given time period.

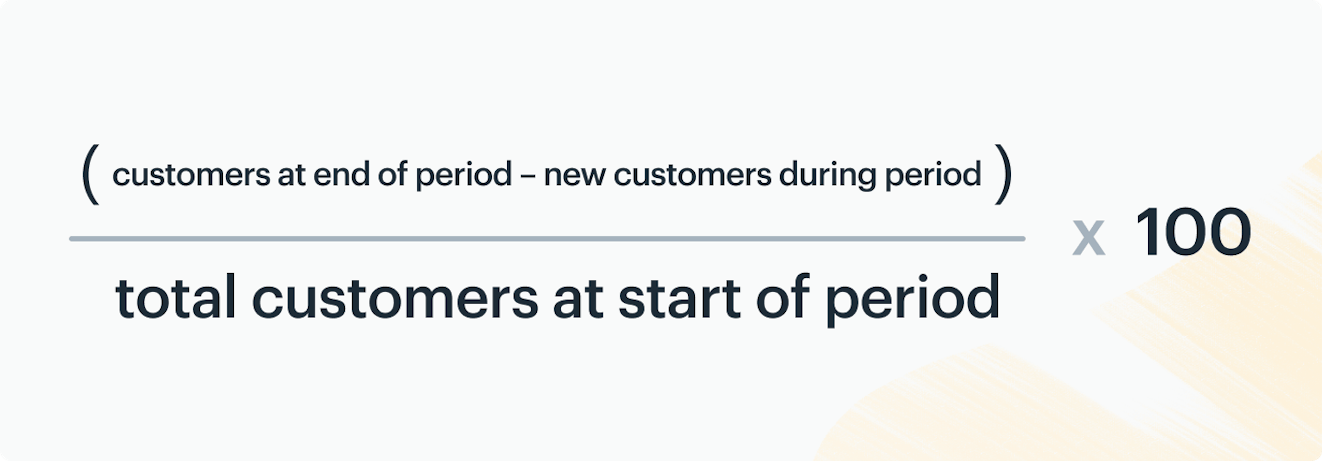
CRR = ((Customers at end of period - New customers during this period) / Total customers at the start of the period) x 100
CRR measures actual customer loyalty over time (as opposed to NPS, which is about a customer's self-reported future behavior).
There are plenty more customer service metrics to consider; read our guide to customer service metrics and reports for more information on how to decide on the right mix for you.
Creating customer advocates
When we shift away from scores and labels, NPS is really a way to understand if your business is creating fans: The sort of people who will recommend you to their friends, help people get started with you, and bring your service into their next job.
As long as you focus your efforts on understanding what influence you can have on creating more of those people and helping them to succeed, NPS can be a useful part of your customer experience toolkit.