11 Key Customer Service Metrics + 4 Real Example Reports


Customer service is a highly measurable activity, and the support software you use inevitably gives you access to a ton of customer service metrics.
Call volume, chat times, resolution rates, interaction counts, and myriad other numbers are more easily recorded and measured today than ever before.
But having access to that data is only the first step. The bigger challenge is deciding what data matters, how to report that data to your leadership, and what context is needed to help the rest of the company understand the impact your work is having on the business (and your customers).
In this post, we're going to simplify that challenge by giving you 11 meaningful customer service metrics, a process for choosing the right metrics for your team and company, and some example customer service reports shared with us by other support leaders.
Prefer to watch a video instead? Check out this 30-minute webinar on the essentials of customer reporting:
11 meaningful customer service metrics
Customer service metrics can be easily measured at the level of the individual support request and then aggregated to report on overall team and individual customer service agent performance.
Many companies use different metrics that report at the case level, individual agent level, and team level to get a holistic understanding of the organization's performance. By correlating customer service metrics at different levels, your management team can better grasp leading indicators for performance and make meaningful changes to your support strategy.
Case-level metrics
Case-level metrics are an excellent way to generate customer service reports that you can use to manage your hiring, staffing, and even product strategies. Use information about topic, time created, and location to help your team understand where and why you are most busy.
Volume based on topic, for instance, shows where your customers are having the most trouble. If you see that 25% of your cases by topic are account questions, it may mean that you need to rework your documentation around that part of your product or maybe even make product changes.
When correlated with other customer support metrics, case-level metrics can also help pinpoint critical areas of opportunity. For instance, correlating cases by topic and customer satisfaction can indicate areas of your product or support experience that delight your customers less than others.
If all of your conversations related to your billing page have a lower CSAT, it may mean you need to either improve your strategy of response or change the billing page itself.
1. Cases by time created
Review the volume of new conversations created in any given time frame. This metric can help you identify times when your customers are most active and help you better set staffing levels to match demand.
If you notice that you have an increasing number of conversations coming in overnight, it may be time to consider staffing additional team members during that time. Of course, companies can best use this metric when correlated with agent capacity.
If you do not have enough volume coming in overnight to reach agent capacity, you may be able to wait a bit before hiring new folks. After all, unless you have other work that needs to be done (such as documentation or operational tasks), you don’t want to staff a role and not have enough to keep them busy.
2. Cases by topic
If you use tags or custom fields to label conversations, you can quickly spot changes in volume that might indicate a problem in your product or the effectiveness of an improvement you’ve already made. For example, has that new redesign reduced questions about updating a password?
Customer service reports by topic, especially around case volume, also give an excellent view into how your team's volume is trending. You may see that conversations around a topic grow or decrease over time.
Use that data and compare it with actions you have taken within your support strategy to understand the efficacy of your changes. If the volume is growing, it may be that the work you've done isn't as impactful as you thought.
3. Cases by location
Understand where you have the most customers needing help so you can support them appropriately, or perhaps consider adding options like localization or support in other time zones.
Speaking the same language is essential: 72.4% of consumers said they would be more likely to buy a product with information in their language. Language is also a comfort — when you can understand which language most of your customers are speaking or where they are coming from, you can provide an even better experience.
Different countries may also have cultural differences that affect how they perceive your support. By knowing which countries are reaching out most often, you may cater better to specific populations.
Individual agent metrics
Customer service metrics at the agent level are a great way to understand how individual performances contribute to the larger team's productivity. Understanding how each team member contributes and benchmarking performance are critical steps for coaching toward growth.
Beyond that, individual agent metrics often correlate up to team level metrics. Companies can also attribute average handle time and time to first response to individual team members.
Consider which types of behaviors you are trying to incentivize and encourage within your team, then use customer service reporting to get a handle on it.
4. Resolved cases
How many conversations did this person close in a given period? Averages aren't always illuminating, but trends over time can reveal top performers and those who may need some more help.
This metric can also help inform how far along in the onboarding process someone has come. As you integrate new team members and they learn more about your product and processes, you can safely expect this number to go up. If you notice stagnation or the number of resolved cases going down, it may indicate that the individual needs more help or training.
The same can be said for seasoned members of your team. While a drop in resolved cases can be a sign of burnout or a team member not being as well-informed on certain product functionality, it may also indicate other shifts in your support volume.
For instance, tickets might be becoming increasingly complex and require more effort to resolve, thus taking up more time and keeping your agents from working through as many tickets.
5. Customer interactions
A team member can be doing an excellent job while showing fewer than average resolved cases. Measuring individual interactions helps compare workload and working style.
You may have some team members who can power through hundreds of tickets a day, whereas others max out at thirty. Consider the types of conversations that each team member handles and the depth they put into their troubleshooting or discovery before responding.
For instance, if the team member who responds to thirty tickets a day often responds to tricky technical issues or has an extremely high first contact resolution rate, it makes sense that they would also handle fewer tickets.
With information like this, instead of shifting the volume higher for the person who responds to fewer tickets, you can assign each person the types of tickets they are best equipped to handle. That may mean putting the lower-volume person explicitly on technical tickets and the higher-volume individual on low-hanging fruit.
Cater to your team's strengths, and your customers will be happier for it.


6. Customer satisfaction
When customers rate their support experience, they may also be rating the product or service, so any individual rating isn't necessarily meaningful. Looking at longer-term rating averages for individuals and across the team is more helpful in spotting champions or those needing to improve.
You can also track customer satisfaction over time or as it correlates to product releases, bug improvements, or exciting announcements. This metric is handy when linked to the "cases by topic" customer service metric noted above. Looking at these two metrics together can give you information about if:
Agents are well-informed enough to answer questions about specific product areas or new features.
Certain product areas are frustrating your customers or causing problems.
Documentation around features is lacking.
New announcements and changes aren't sitting well with customers or users.
Your company needs to improve its product marketing or announcement methodology.
Support agents don't have the necessary vocabulary to explain to customers the "why" behind changes or features.
Use the reactions in your CSAT as they correlate to topics to inform your strategy and areas of improvement moving forward.
Recommended Reading


7. Average handle time
For individuals, having a low average handle time can reflect their comfort and skill with the work, meaning they get through cases quickly. Be careful to review it in the context of the type and complexity of the tickets.
Similarly, be wary of incentivizing average handle time too heavily. If you are encouraged to respond quickly to boost this customer service metric, you may find that your agents start to slack on the quality of their responses. It's easy to be fast if you aren't worried about whether your answer is 100% correct.
Average handle time is best when managers relate it to topics rather than to individual agents. Doing so will help inform your team's leadership if specific topics or areas take longer to answer questions about.
For instance, you might expect the subject of "bugs" to have a slower average handle time than "getting started" types of questions.
Team-level metrics
To manage anything well, you need to have metrics around it. While both agent- and contact-level metrics are valuable, team-level metrics are the foundation of meaningful growth.
Use the more granular metrics to understand your opportunities, then use customer service reports around your team-level metrics to see how the changes in your strategy are working.
Team-level metrics are most valuable when viewed over time. These metrics will best suit teams looking for a gradual improvement or exploring how significant outages or new announcements affect them. However, you shouldn't expect drastic changes week over week with these types of metrics.
8. Time to first response
How soon after a customer requests your help do they get an initial reply? Does it take longer for escalated tickets to get a response than run-of-the-mill product questions? Customer expectations for response time will vary from channel to channel, so it's worth splitting your metrics out by channel, too.
This metric usually serves as a leading indicator for customer satisfaction. This means if you begin to lower this number, you will start to notice your CSAT gradually rising. After all, customers don't want to wait long for responses and are generally delighted when a reply arrives more quickly than expected.
For that reason, some companies choose to flip the strategy of responding to the oldest tickets first. For specific questions or low-hanging fruit, your company may consider responding to the newest questions first, just to see how it affects your relationship with customers or your CSAT.
However, be careful experimenting with all types of inquiries when considering time to first response: Some types of conversations, like bugs or account/billing issues, require more adherence to the traditional strategy to treat every customer fairly.
Recommended Reading

9. Interactions per resolution
Generally, the fewer interactions it takes to resolve a conversation, the happier customers will be. If that number is rising, it can be an indicator of product or service issues or a shift in the type of customer you are helping.
Instead of looking at this metric on a short-term basis, understand whether it has gradually increased or decreased over time. Similarly, consider segmenting out different topics to see if the number of interactions per resolution is higher for some than others. It may make sense that technical conversations require more interactions to resolve than basic product questions.
A few ways you can lower this metric if you notice it's starting to climb:
Retrain employees on the topics where you notice this metric is the highest.
Implement or improve your saved replies.
Update internal and external documentation to provide additional resources for team members.
Identify areas of the product that create additional complexity within the context of customer service.
Ask customers for additional information in your automated responder that acknowledges receipt of their conversation.
Trigger automated routing based on specific "keywords" to ensure that the ticket gets to the best team member as quickly as possible.
10. Average handle time
Handle time reflects how long a conversation is open before your team takes follow-up action. Long gaps might mean opportunities to improve processes, training, or tooling to get that answer back more quickly.
This is another customer service metric that is most effective when segmented. While it's excellent to understand how long your team is taking overall, it's more beneficial to understand if individual topics take longer than others.
Tracking this at an individual level can also be helpful for understanding the health of your team members. While it can be concerning to see average handle time starting to rise for a specific team member, use it as a jumping-off point for conversation rather than accusations.
Rising average handle time can certainly mean dwindling focus, but it’s just as likely to be a leading indicator for burnout or job dissatisfaction.
11. Customer contact rate
This measures the percentage of your active customers who request help in a given month. Improved self-service options, bug fixes, clear product descriptions, and product design can all help reduce that rate as you grow.
You should look for that perfect "hockey stick" growth when it comes to this metric — meaning that it rises gradually before leveling out. While you don't want customers to stop contacting you entirely, at a certain point, the work you are doing with your ticket deflection should level out the growth.
Segment out your customer service reports to understand where most of the contacts are happening, and you'll have a clear map of what you can improve.
If you notice that conversations around your account page grow more rapidly than other topics, for example, you may have a case with your product team to improve the page, or you may just need to write more detailed documentation.
Use the metrics at your fingertips to create a road map around what you can impact, and implement service strategies to make meaningful changes.
Recommended Reading

How to measure and report on the right metrics
As a customer service leader, you have access to most of the numbers above — and probably a ton more. The challenge is deciding which to report on, who to report it to, and how it should be presented.
To figure out the most important metrics for your team, consider these three questions:
Why is measuring a specific metric important?
The point of your customer service team is (I hope!) not to generate nice-looking graphs and reports. It’s to provide great service to your customers. Metrics are just a more measurable proxy for the real outcome.
For example, Kristin Aardsma is head of support for Basecamp, a company that considers their great service and fast response times to be product features. For Aardsma’s team, the combination of first-response time and customer satisfaction is a meaningful way to tell if they are staying on track.
Another example: During the high growth days of Mailchimp, Bill Bounds’ single most important job was hiring enough new staff to maintain support quality. In his words, “We were so focused on growth and getting enough people in that my primary concern was really on, ‘Hey, we’re not done hiring yet.’” So Bounds’ primary metrics were trends of volume per agent and customer satisfaction level.
When you are clear about why you are reporting, you can decide more easily what you should measure and report on and — equally important — what not to measure and report on.
Who are you reporting to?
Understanding your audience is critical to communication in all forms. What matters most to your frontline support team might not make any sense to your CEO who doesn’t have that ground-level perspective.
What you show and how you explain it might differ considerably depending on who you are reporting to. At Campaign Monitor, customer service reporting is done at three levels, and the contents of those reports are slightly different each time:
Individual agents are emailed daily reports on their personal activity and their team’s activity.
A monthly report is shared on the internal wiki with the whole company. These reports remove some of the individual agent details but add some long-term perspective.
The highest level of reporting is presented on a couple of slides to the senior management team with some written comments to explain the trends on display.
As a global and distributed company, that’s a great way to make sure everyone is up-to-date.
Alternatively, SurveyGizmo’s team is all in one building. The director of customer service presents the weekly reports in person to the support team, and there is an open discussion that senior managers are invited to attend. Physical proximity means that their whole team gets the full context and can ask for clarity easily.
Make sure to determine who you are reporting to and what they care most about. That will help direct you to the right measures.
What outcome do you want to see?
“What gets measured gets managed,” said Peter Drucker, America’s father of management philosophy.
It’s an appealingly concise piece of wisdom: You will effect change on those things you pay attention to. But as unemployed phrenologists will attest, something that is measurable is not necessarily meaningful.
“There can be too much emphasis on fluff numbers in support,” says Help Scout’s Justin Seymour. “The team likes to know what our goals are, what types of conversations we’re having, and how we’re moving the needle month to month.”
The customer service leader is in the best position to understand where the biggest opportunities are for the company. For Bounds at Mailchimp, he needed to quantify his need for more support staff, so he focused his reports on telling that story clearly and accurately.
Campaign Monitor, meanwhile, is a product company at its core, and identifying ways to improve the customer experience through a better product is a big focus of customer service reporting.
Your management team can’t have the perspective you can as the customer lead, so you need to lead them honestly and efficiently to a greater understanding of what action needs to be taken — and you can do that through consistent, clear reporting.
Recommended Reading

The qualities of a perfect customer service metric
Ultimately, the metrics you choose to report should meet all of the following criteria:
Meaningful — They should tie back to something your company wants to achieve. For example, when your goal is highly responsive support, time to first response is an ideal metric. Resolution time may not matter.
Moveable — You should measure things on which your team can have impact. If you find that something you’re measuring doesn't matter, you have the freedom to drop that metric.
Authentic — Your reports must tell a true story. It’s possible to use real numbers to send a misleading message. Be honest even when it hurts.
Contextualized — Numbers in isolation can be stripped of meaning, so provide them in context.
Consistent — The trends over time are usually more important than specific data, and looking back over a quarter or a year can give you some fantastic insights and encouragement.
Building an impactful customer service report
When creating reports, follow these guidelines to make sure your reports are truly impactful:
Focus on trends — The direction of change usually matters most. Having an 80% customer satisfaction rate may not sound great, but a month-on-month increase from 70% to 80% is excellent news.
Direct limited attention to anomalies and changes — Your leaders are busy people, and they have a limited amount of attention to give you. Make sure it’s easy for them to understand what your reports mean. Consider providing an overall summary. For example: “We received 20% fewer questions about exporting this month, so the reworking we did in the app saved us 12 hours of support time already!”
Look for correlations that tell a bigger story — Looking at individual metrics is useful, but understanding the connections between them is where the real insight can come.
Combining metrics can also help you identify deeper issues. For example:
“When our email time to first response goes above four hours, we see consistent dips in customer satisfaction.”
“Answering billing questions takes us three times the average ticket length.”
Below is an example from my experience at Campaign Monitor. Our reporting tool could tell us when tickets arrived and how long customers were waiting for a first reply, but it couldn’t show us how many tickets were waiting for us to respond to at any given time.
By exporting data from our help desk and combining it with a week’s worth of manual measurements, we could produce a single chart that showed the correlation between larger queues and higher waiting times.

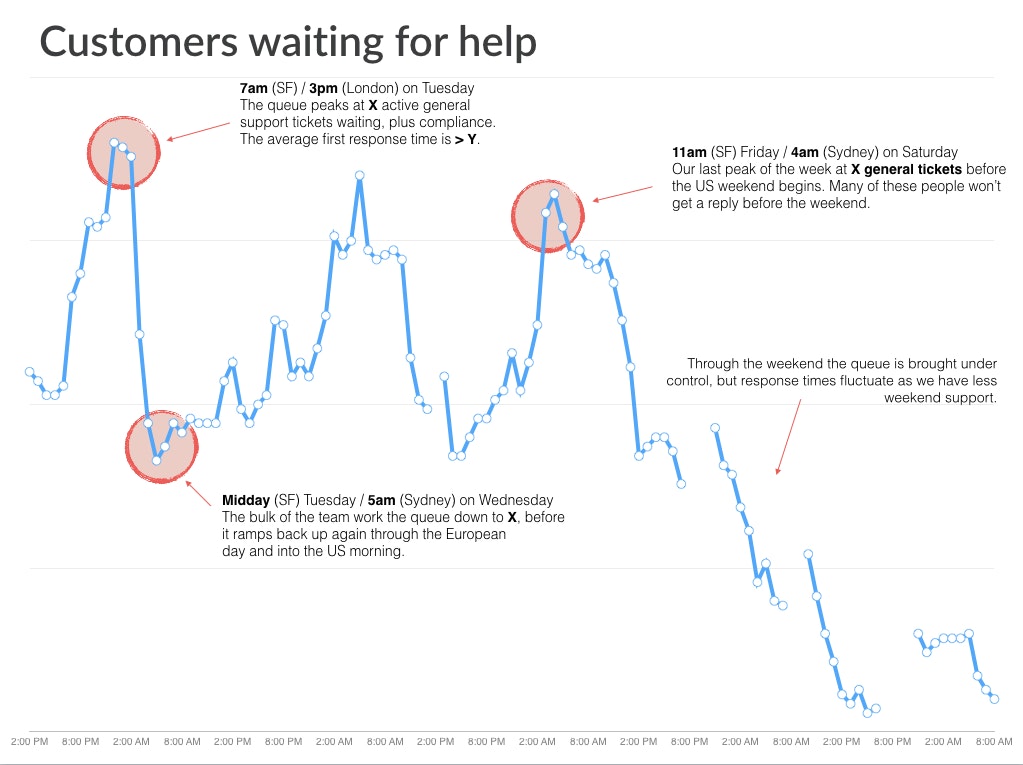
Our support team reviewed this chart, which stimulated a discussion about the stress and impact of a large queue of waiting tickets. Davida, our Head of Support, worked with her team to split our main queue into smaller, more manageable chunks. That change created a significant decrease in response times without adding any new resources or changing the volume of tickets.
4 customer service report examples
Whether you’re building out your first customer service reports or you’ve been producing reports for years, there is always an opportunity to make those reports more effective at driving improvements in your business.
Consider the four example customer service reports below — each from a real customer service team — to brainstorm some new ideas for your own reports.
Note: The format and structure of these reports are real, but we’ve obscured the actual numbers.
1. Help Scout
The Customers team at Help Scout meets weekly to discuss general team business. We believe reports are best evaluated as part of a conversation, not a simple list of metrics. Individual goals are discussed in weekly one-on-ones with a player’s coach.
The head of support presents the team’s goals once a month during the company leadership meeting. In Help Scout’s quarterly company-wide Town Hall meetings, the head of support presents a slide or two refreshing the company on team goals, the progress we’ve made, and any upcoming changes and hiring plans.
When evaluating a reporting goal, we aim to define four things for the team:
Why do we care about this?
How are we currently doing?
What are the limitations of this metric?
A simple summary of the main takeaway we want the team to know

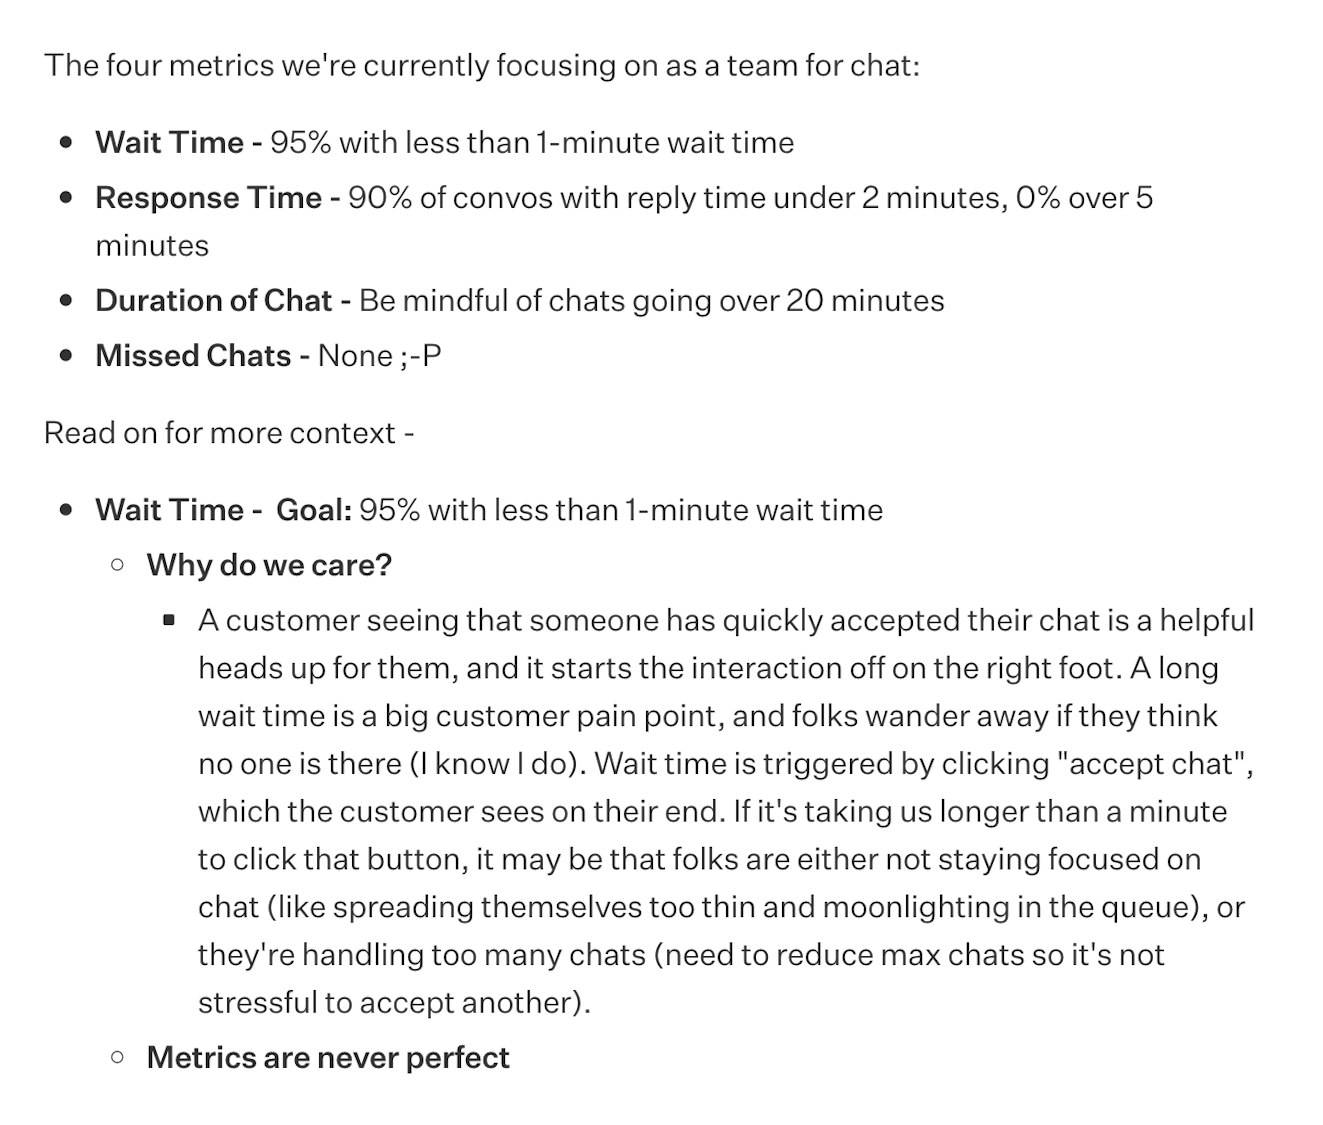
A few notes:
While we rely on our own reporting tools, our internal support reporting focuses on the narrative these metrics tell.
We use reports to keep a quantitative eye on our goals, but we never treat these numbers as "hit at all costs." An overly rigid focus on quotas can often backfire and lower quality and team motivation.
Volume of data should always be taken into account, and different timeframes may be useful to examine different metrics. For example, we may evaluate the team happiness score once a month but individual happiness scores looking back six months.

2. Shinesty
"Here at Shinesty, all stakeholders share reports from their department in what we call our Q4 post mortem," says Antonio King, Director of Experience. "We build reports and list findings within the information/data we’re sharing. Additionally, we share insights to gain feedback or to deploy another set of eyes."
King came on as Support Leader in 2016. Since then, Shinesty has begun looking at self-service statistics to identify any service gaps, as well as looking at more high-level metrics.
Shinesty looks at the following self-service metrics:
content views
top articles
bounce rate (Google Analytics)
sessions (Google Analytics)
searches (Google Analytics)
pages/session (Google Analytics)
missing articles/content gaps
feedback ratings
deflections
handling time per deflection

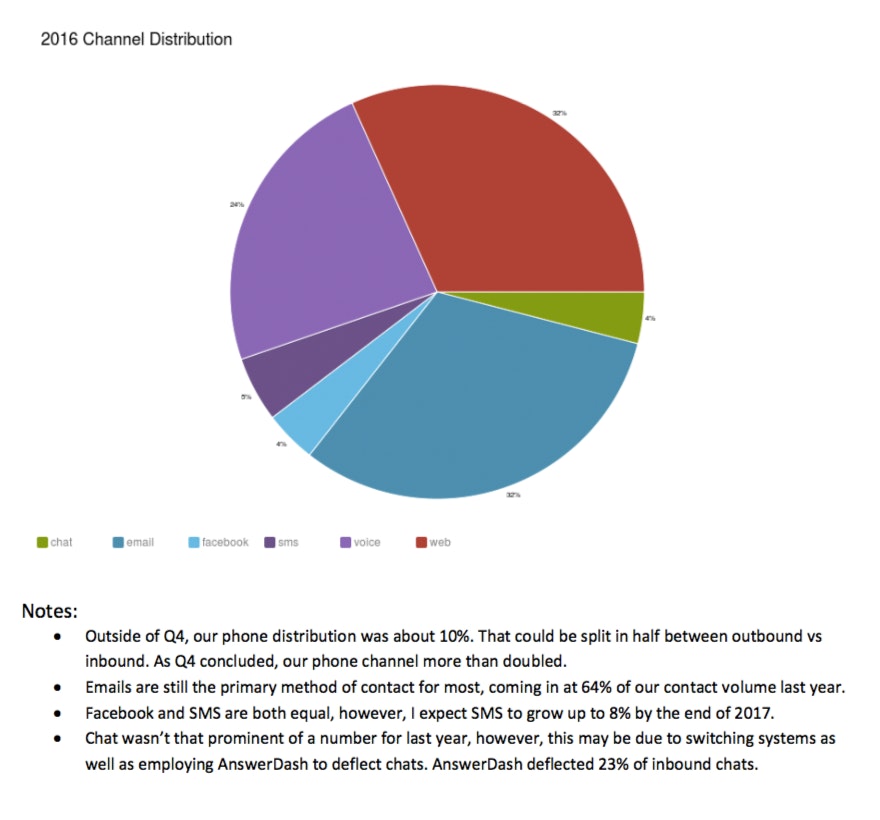
A few notes:
Contextual explanations are included in the reports directly to frame the report with an overall story.
Data comparisons to previous periods help add meaning to the graphs.
3. Celtra
"My primary purpose in reporting is to show that we’re doing a consistently good job — and that there are no red flags to be aware of," says Vuk Lau, Director of Client Support at Celtra. "I share my reports monthly in a Google Doc with our Sales and Service executives — and with my team."
Lau makes these reports available for everyone in the company to view, and he also produces more detailed reports, including hourly and daily distribution, client comments, and CSAT metrics, quarterly and annually.

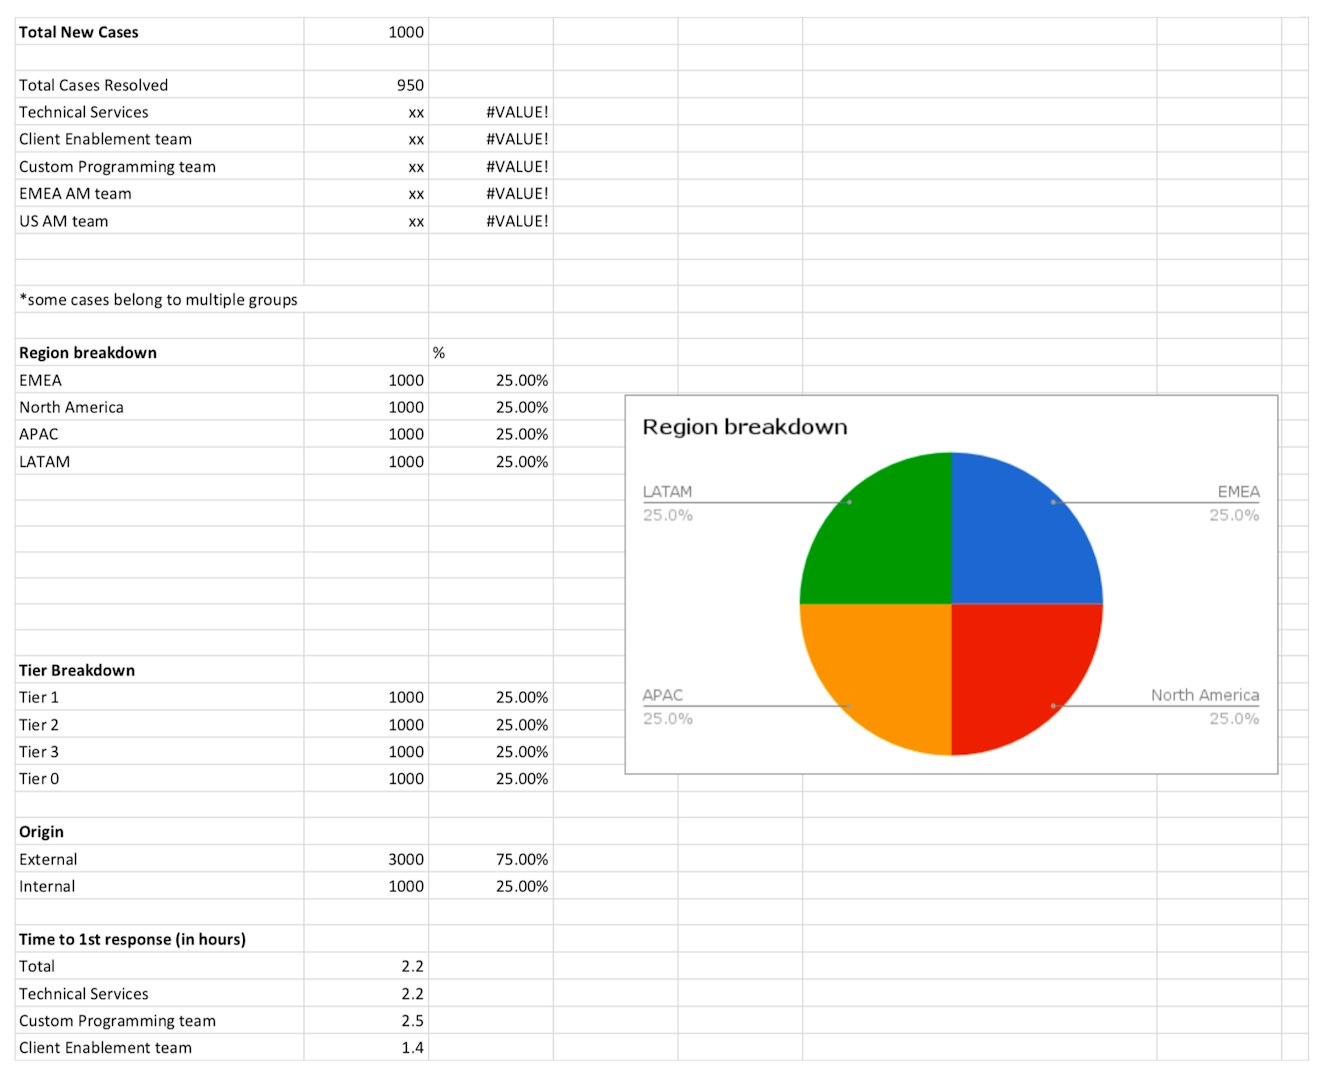
A few notes:
The support volume is broken down by region, team, and tier.
Individual agent performance is also tracked.
The label breakdown helps identify the major sources of incoming support requests.
4. Jayride
At Jayride, the team stays on top of reports by touching base daily, weekly, and monthly. Reports are posted in a Google Sheet so each team can track their own progress.
Aaron Lewin, Head of Customer Service, says they hold a daily 10-minute meeting with management and department heads where they talk about “what we did yesterday, what we're doing today, roadblocks, and wins. At the end of standup we also review the overall company targets (Passengers travelled, Booking Unit Profitability). All team members are encouraged to attend and listen."
Levin meets weekly with the head of operations to discuss his personal reports. Then, each month, each team showcases their progress to the entire company. These reports include conversions, resolution time, and support unit costs.

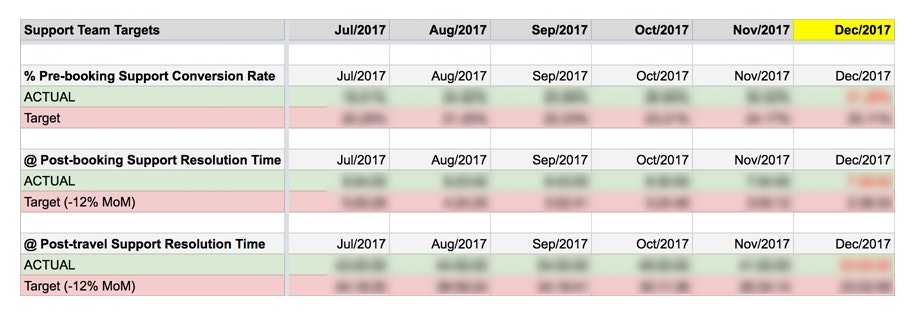
A few notes:
The support team has conversion targets that are tracked separately for pre-booking and post-booking interactions.
Individual agent performance is also tracked.
The label breakdown helps identify the major sources of incoming support requests.
What metrics will you report on next month?
Customer service metrics matter. What you choose to report on and how you report it can make a real difference in the level of service you provide.
Don’t waste your valuable time compiling reports that provoke no questions and generate no action. Bill Bounds said it beautifully: “Metrics only tell you where to look for the story; they don’t tell you the story itself.”
Pick the right metrics and use them to tell a compelling story about how your customer service team is contributing to your company’s goals.


Get Started
Learn the platform in less than an hour.
Become a power user in less than a day.